Section: M&S Control
Subject: Procedure – Generate an M&S Recap Report
Approved by: Tony Massey
Effective Date: 21 December 2021
Last Reviewed Date: 21 December 2021
Policy Owner: ERP Financial Manager
Policy #
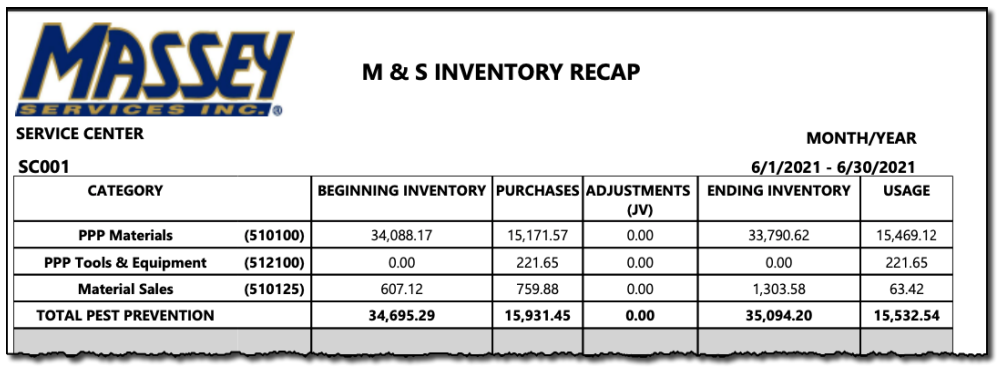
Inventory Recap Report #
The Recap Report provides the manager the Service Center’s total M&S usage by category. It’s the simple equation:
Beginning Inventory + Purchases + Adjustments – Ending Inventory = Usage
Usage by category is used to calculate category usage as a percent of revenue. This is done by dividing the total category usage by the total category production.
Example: A Service Center used $15,532.54 in pest materials. They completed $302,778.55 in pest production. Their pest M&S is 5.13%.
(Total Category Usage )/(Total Category Production)= Category Usage Percentage
($15,532.54 )/$302,778.55=5.13%
Steps to Generate the Recap Report: #
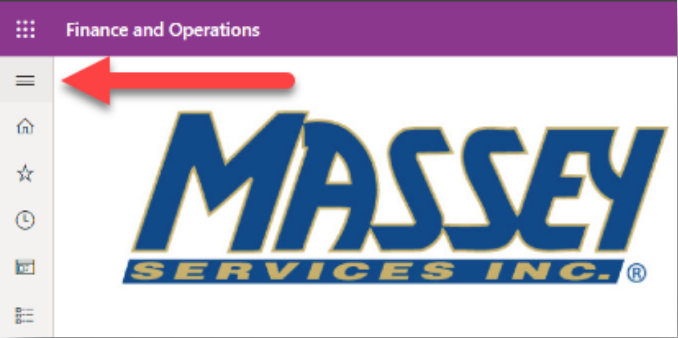
1. Log in to Microsoft D365.
2. Click on the Modules Pane (≡ top left).
3. Click on “Inventory management” from the menu items.
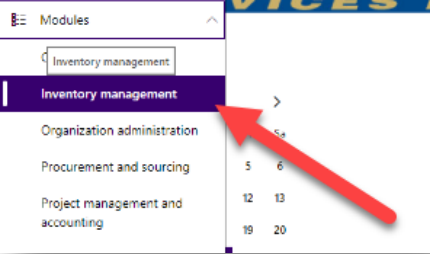
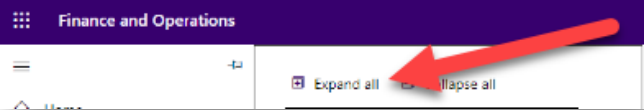
4. Click “Expand all” (top of the pullout menu).
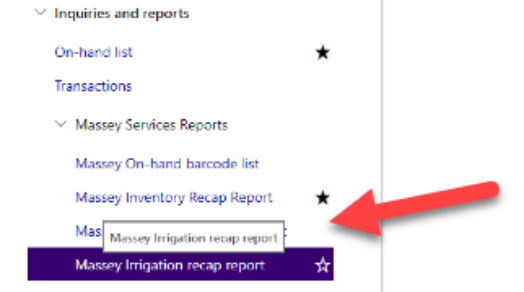
5. Under the Massey Services Report menu, click which recap report you are seeking.
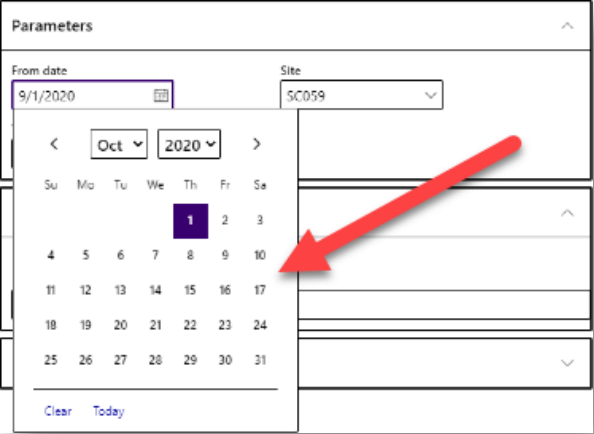
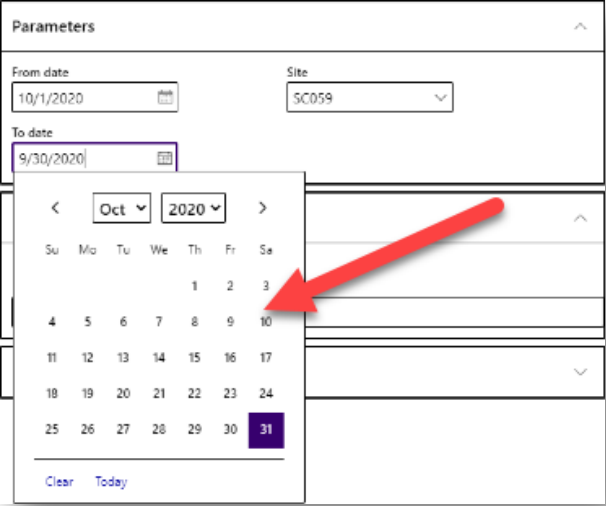
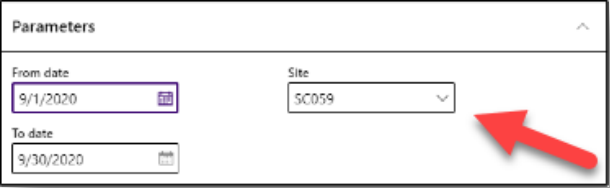
6. Click the calendar icon in the “From Date” menu (right side of the screen). Select the first day of the month.
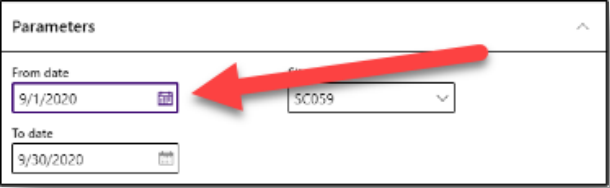
7. Click the “from date” that you would like for the report.
8. Click the calendar icon in the “To Date” menu (right side of the screen). Select the last day of the month.
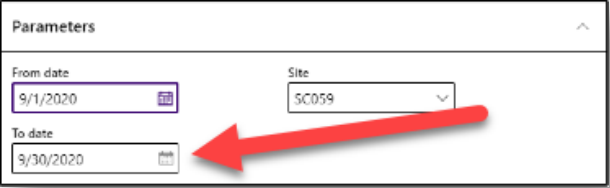
9. Click the “to date” that you would like for the report.
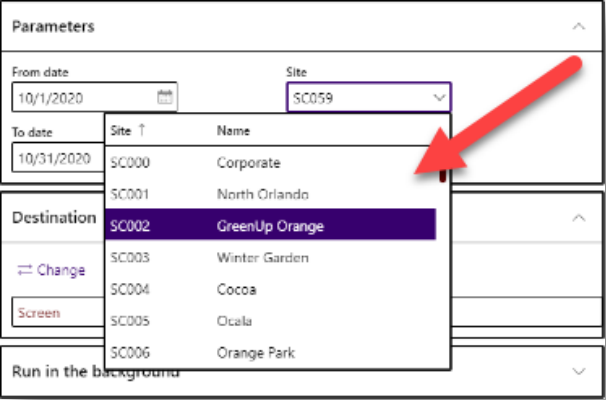
10. Click the down arrow next to the site name. The site name is the Service Center location number.
11. Scroll and click on the desired service center name.
12. Click “OK” to generate the report (bottom right). A sample report is provided on the next page.