Section: Misc. Operations Reports
Subject: Daily Operations Report
Approved by: Eddie Faircloth
Effective Date: 1 March 1999
Last Reviewed Date: 1 March 1999
Policy Owner:
Policy #
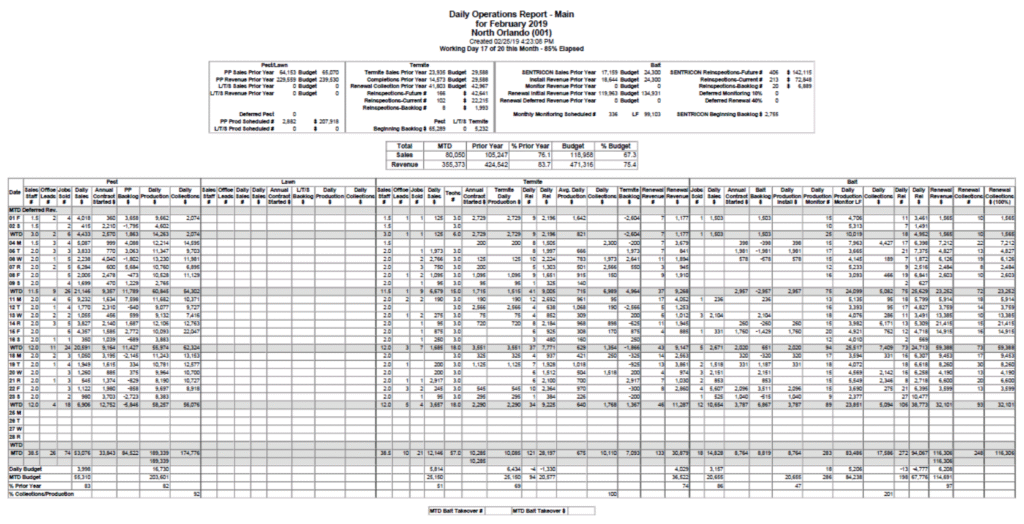
The Daily Operations Report (DOR) is a valuable Management tool. On a daily and month-to-date basis, it is used for reporting and monitoring the following areas of our business:
Sales (future revenue)
Production (Current revenue)
Backlog (services sold and not started / completed)
Collections
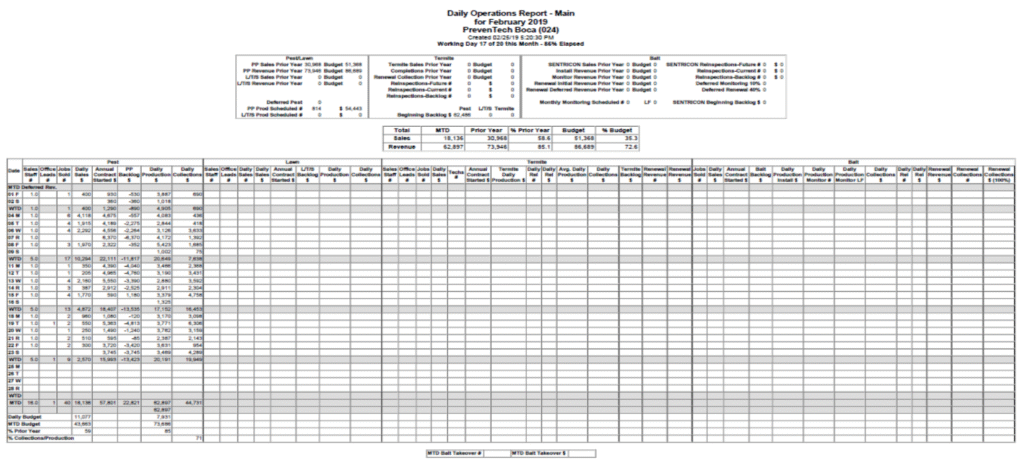
The DOR will be completed by Service Center Administrative personnel daily and will summarize the previous day’s sales, production and collection results for each part of our business (Residential and Commercial Pest Prevention, Termite Protection, Bait Protection, and Lawn Services). Besides the numbers you enter daily, the DOR carries month-to-date totals. The DOR form above is used to record this information.
The DOR must be completed by 10:00 A.M EST every Monday through Friday. The following procedures provide step-by-step instructions for its completion (except for the headers, each item number corresponds to a column number on the form).
Residential DOR #
DOR Headers #
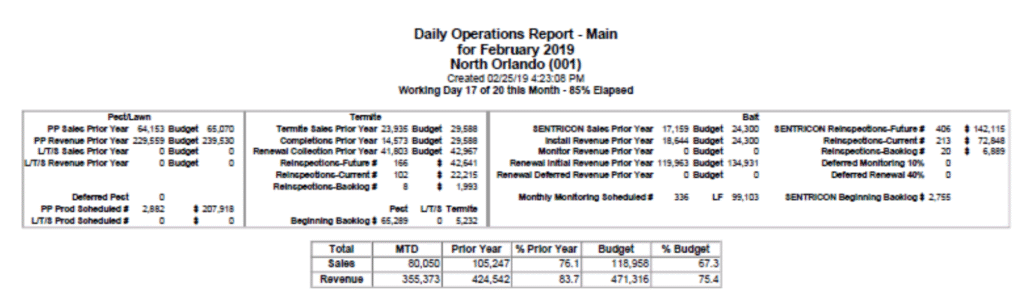
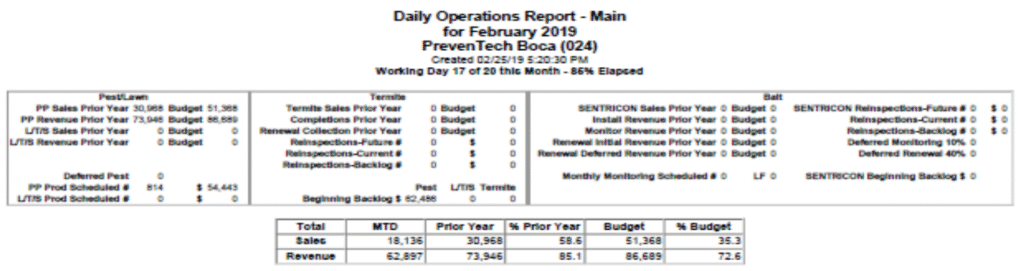
Headers: These figures are brought forward by the Reporting Department at Corporate as specified below:
- Sales:
- Sales Prior Year – Figures are obtained from prior year DOR for the same month.
- Budget – Figures are obtained from the current month budget sheets, which were prepared and agreed to by General Manager and Regional Managers during their budget session.
- Revenue = Completions = Installs:
- Prior Year – Figures are obtained from prior year DOR for the same month.
- Budget – Figures are obtained from the current month budget sheets, which were prepared and agreed to by General Manager and Regional Managers during their budget session.
- Production Scheduled:
- Total Pest Production Scheduled – Figures are obtained from the Production To Do.
- Monitoring Scheduled – Figures are obtained from the Production To Do.
- Beginning Backlogs Figures:
- Reporting will fill in the Backlog numbers for the sales that were not started the previous month.
- Service Center Daily Progression:
- This section displays the service center name, month and year, as well as the current day of the DOR.
- Working Day # – How many days have elapsed in the month.
- Out of Monthly – How many working days were available at the start of the month.
- % Elapsed – Working days divided by how many days were available reflects the percentage of month gone.
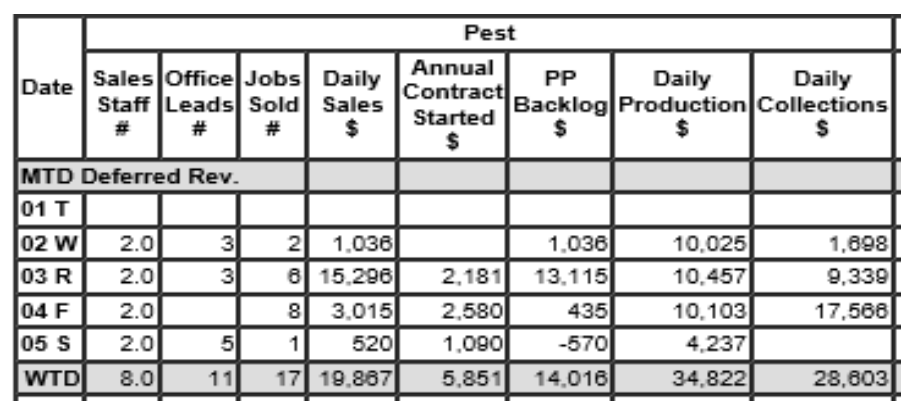
Pest Section #
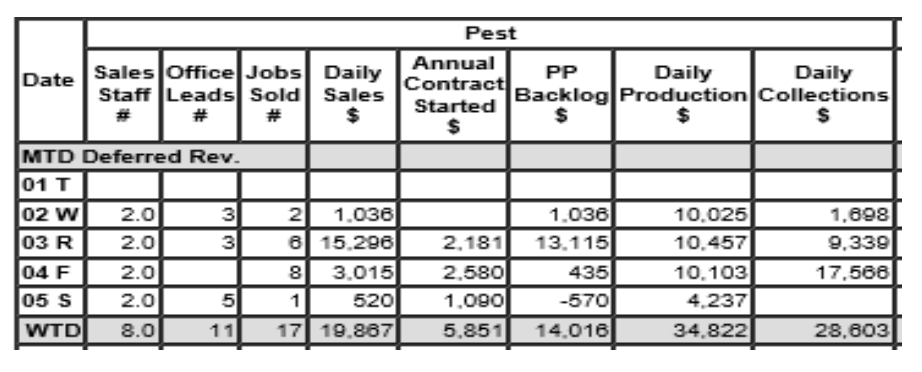
Total Sales Staff – Enter the number of sales inspectors working that day. (Divide the total sales staff number between Pest, Lawn and Termite.)
Office Lead – Enter the total number of Pest Office and Web Leads received for the day. (This figure will be obtained from the Call Log Reconciliation Report found in the reports tab of the Lead Log.
Jobs Sold # – Enter the total number of PPP/CPP and one-time Special Services sold.
Daily Sales $ – Enter the annual value of all PPP/CPP and the total value of all one-time Special Services sold.
Annual Contract Started – Enter the combined PPP/CPP and Special Services annual value of all the INITIAL services completed.
Pest Backlog – This is a protected formula field, and it is calculated automatically. (This figure is calculated as follows: Daily Sales (Column 4) less the contract Value Started (Column 5) giving the daily backlog (Column 6)). MTD backlog is calculated by taking the beginning backlog (carried forward from previous month, Daily Sales $, minus Contract Value Started.) (This number is balanced against the actual service center Backlog found in the G: directory in the Service Center Excel folder.)
Daily Production $ – Enter the dollar amount of all PPP/CPP services from all technicians’ production totals, from their daily route sheets. The figures will include the initial service charge for new starts and the total charge for one-time special services. (These figures are balanced against the Completed Billing/Production Report found in Service Pro.)
Daily Collections $ – Enter the dollar amount of the service center and corporate PEST deposit, plus/minus any funds transferred to/from other service centers. (This figure is recorded and obtained from the Daily Deposit log, which has been balanced with the Payments in Total by Service.)
Lawn Section #
Click here to go to that section
Termite Section #
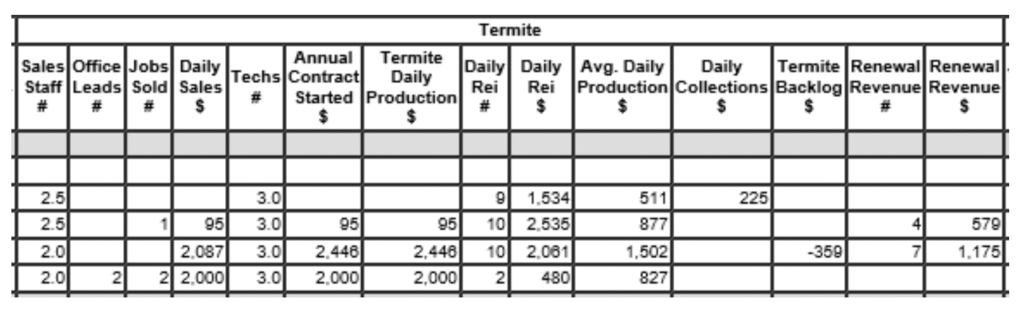
Sales Staff – Enter the number of Sales Inspectors working that day.
- Divide the total sales staff number between Pest and Termite
Office Leads – Enter the total number of Termite Office and Web Leads received for the day. (This figure will be obtained from the Call Log Reconciliation Report found in the reports tab of the Lead Log.
Jobs Sold # – Enter the number of conventional Termite services and one-time Special Services sold that day.
Daily Sales $ – Enter the annual value of all termite treatments sold: total value of all subterranean,fume, termite transfer, WDO, one-time special services sold and the liquid treatment portion of any Total Coverage Baiting sales for that day.
Tech # – Add all hourly-paid termite technician hours from the Termite Technician’s daily reports. Also, count the hours worked by any non-hourly employee performing termite treatments or reinspections. Divide the total by eight to determine the number of technicians.
Annual Contract Started – This is the dollar amount of all termite production completed from the Technician Summary, plus the amount of any liquid treatments on total coverage baiting contracts completed that day. This will balance to the Annual Value Started $ on the backlog and the production portion of the Completed Billing/Prod in Total by Service Group.
Termite Daily Production $ – This is the dollar amount that was billed to the customer. This will match the Annual Contract Started on the backlog except when an upgrade was sold with a Bait Pay Plan. This will balance to the billing portion of the Completed Billing/Prod in Total by Service Group.
Daily Reinspection # – Enter the number of Conventional Reinspections (count each reinspection report).
Daily Reinspection $ – Enter the total dollar value of all the Conventional Reinspections (the value of each reinspection is at the bottom of the inspection report).
Avg Daily Production – This is a protected formula field, and it is calculated automatically. (this figure is calculated as follows: Daily completions plus Daily Reinspection $ divided by Tech #. This figure lets management know if we are producing work according to company standards).
Daily Collections – Enter the dollar amount of the service center and corporate TERMITE deposits plus or minus any funds transferred to or from other service centers. (This figure is recorded and obtained from the Daily Deposit log, which has been balanced with the Payments in Total by Service report.)
Termite Backlog – This is a protected formula field, and it is calculated automatically (this figure is calculated as follows: Daily Termite Sales less the Daily Completions. The MTD figure is obtained by taking the beginning backlog (carried forward from the previous month and entered in the header section at the top of the DOR form) plus MTD daily sales, minus MTD daily completions).
Renewal Collections # – Enter the total number of service center and corporate renewal deposit units, plus/minus any funds transferred to/from other service centers. (This figure is recorded and obtained from the Daily Deposit log, which has been balanced with the Payments in Total by Service.)
Renewal Collections $ – Enter the total dollar amount of the service center and corporate renewal deposit, plus/minus any funds transferred to/from other service centers. (This figure is recorded and obtained from the Daily Deposit log, which has been balanced with the Payments in Total by Service.)
Bait Section #
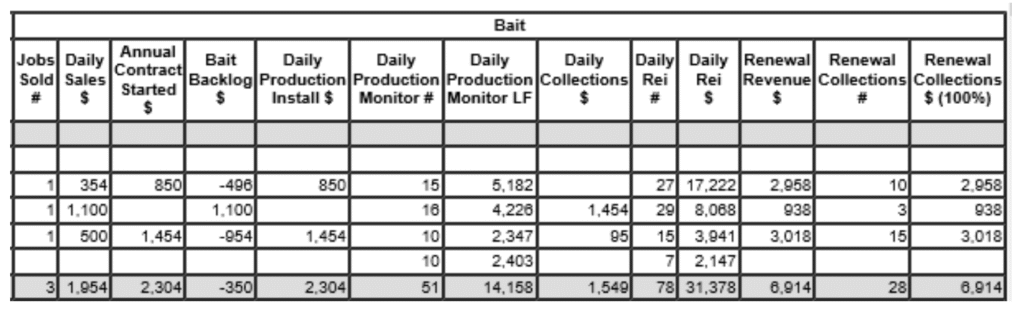
Jobs Sold # – Enter the number of baiting agreements sold that day.
Daily Sales $ – Enter the dollar value of all baiting services sold that day. Do not include the upgrade portion of any total coverage baiting contracts as this application is classified as a conventional termite treatment.
Annual Contract Started – This is the dollar amount of all bait installs that were completed from the Termite Technician’s Daily Summary. This will balance to the Annual Value Started $ on the backlog and the production portion of the Completed Billing/Prod in Total by Service Group.
Bait Backlog – This is a protected formula field, and it is calculated automatically (this figure is calculated as follows: Daily Bait Sales less the Contract Value Started. The MTD figure is obtained by taking the beginning backlog (Carried forward from previous month and entered in the header section at the top of the DOR form) plus MTD daily sales, minus MTD value started.
Daily Production Install $ – This is the dollar amount that was billed to the customer. This will match the Annual Contract Started except when a bait was sold with a Bait Pay Plan. This will balance to the Billing portion of the Completed Billing/Prod in Total by Service Group.
Daily Production Monitor # – Enter the number of accounts monitored for that day.
Daily Production Monitor LF – Enter the total LF for all the monitors serviced
Daily Collection – Enter the dollar amount of the service center and corporate BAITING deposits plus or minus any funds transferred to or from other service centers. (This figure is recorded and obtained from the Daily Deposit log, which has been balanced with the Payments in Total by Service)
Daily Reinspections # – Enter the number of Bait Reinspections done for that day. (Count each actual inspection report).
Daily Reinspections $ – Enter the dollar amount of Bait Reinspections completed for that day. (The value of each reinspection is at the bottom of the inspection report.)
Renewal Collections # – Enter the total number of the service center and corporate Bait Renewal deposit units, plus or minus any funds transferred to or from other service centers. (This figure is recorded and obtained from the Daily Deposit log, which has been balanced with the Payments in Total by Service)
Renewal Collections $ – Enter the total dollar amount of the service center and corporate Bait Renewal deposits, plus or minus any funds transferred to or from other service centers. (This figure is recorded and obtained from the Daily Deposit log, which has been balanced with the Payments in Total by Service.)
DOR Footers #
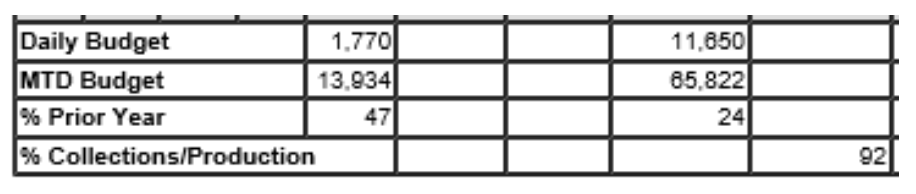
These totals come from the figures entered on the DOR. It is a quick glimpse of where the service center is month-to-date.
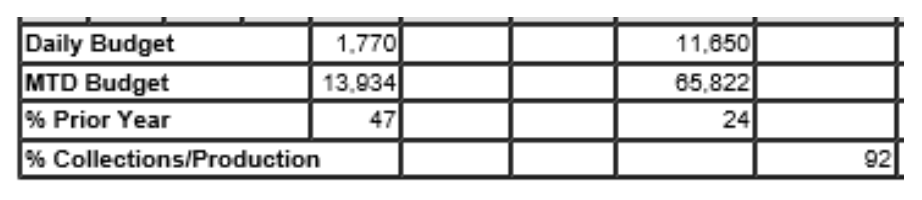
Daily Budget – This breaks down the average sales per day and the average completions per day.
MTD Budget – This breaks down the sales for the month and completions for the month.
% of Prior Year – The Sales or Production/Revenue in comparison to same time last year.
% Collections/Production – Month-to-date collections divided by month-to-date production.
GreenUP DOR #
DOR Headers #
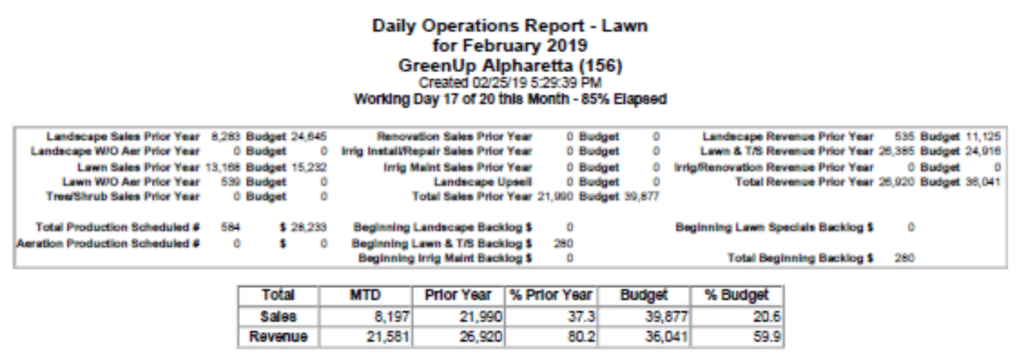
Headers: These figures are brought forward by the Reporting Department at Corporate as specified below:
- Sales:
- Sales Prior Year – Figures are obtained from prior year DOR for the same month.
- Budget – Figures are obtained from the current month budget sheets, which were prepared and agreed to by General Manager and Regional Managers during their budget session.
- Revenue:
- Prior Year – Figures are obtained from prior year DOR for the same month.
- Budget – Figures are obtained from the current month budget sheets, which were prepared and agreed to by General Manager and Regional Managers during their budget session.
- Production Scheduled:
- Total Production Scheduled – Figures are obtained from the Production To Do.
- Aeration Production Scheduled – Figures are obtained from the Production To Do.
- Beginning Backlogs Figures:
- During the first few days of the new month, reporting will fill in the Backlog numbers for the sales that were not started the previous month.
- Service Center Daily Progression:
- This section displays the service center name, month and year, as well as the current day of the DOR.
- Working Day # – How many days have elapsed in the month.
- Out of Monthly – How many working days were available at the start of the month.
- % Elapsed – Working days divided by how many days were available reflects the percentage of month gone.
Landscape Section #
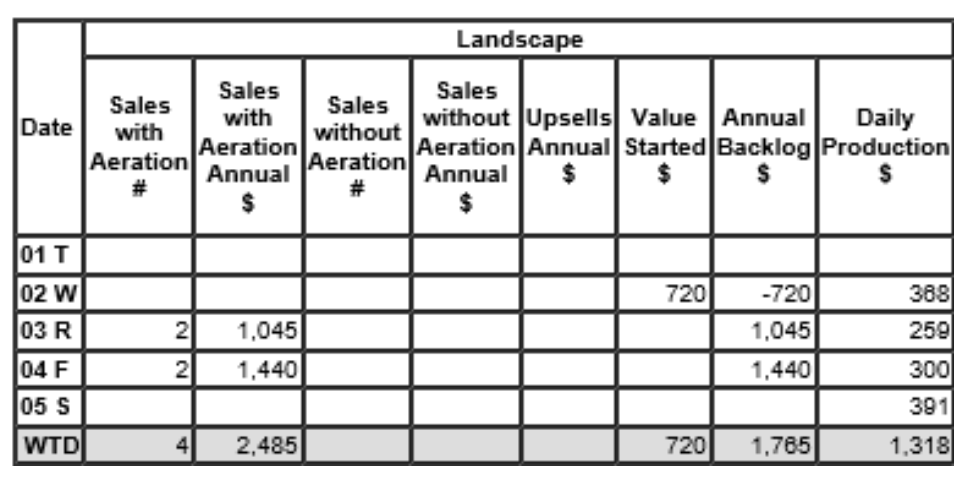
- Sales with Aeration # – Enter the total number of Landscape with Aeration services sold that day.
- Sales with Aeration Annual $ – Enter the annual contract value of all Landscape with Aeration services sold.
- Sales without Aeration # – Enter the total number of Landscape Non-Aeration Annual services sold on the day you are working.
- Sales without Aeration Annual $ – Enter the annual contract value of all Landscape Non-Aeration services sold.
- Upsells – Enter the total value of all upsells. (An upsell is where a lawn customer wants to add Tree and Shrub, an annual aeration, or if there was lawn square footage we were not treating, but the customer wants it treated now.)
- Value Started $ – Enter the combined Landscape Aeration and Landscape Non-Aeration contract/annual value of all the INITIAL services completed.
- Annual Backlog – This is a protected formula field, and it calculates automatically.
- Daily Production – Enter the dollar amount of all Landscape services from all the technicians’ productiontotals, from their daily route sheets. The production figure will also include the INITIAL service charge for new LANDSCAPE starts.
Lawn Section #
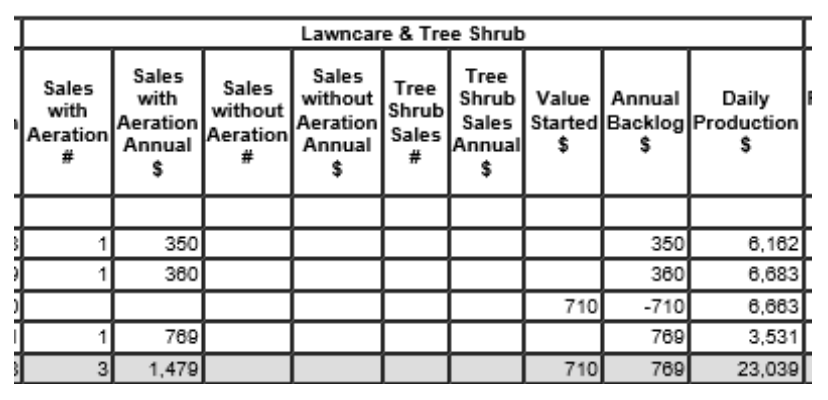
- Sales with Aeration # – Enter the total number of Lawncare with Aeration Annual services sold that day.
- Sales with Aeration Annual $ – Enter the annual contract value of all Lawncare Aeration services sold.
- Sales without Aeration # – Enter the total number of Lawncare Non-Aeration Annual services sold.
- Sales without Aeration Annual $ – Enter the annual contract value of all Lawncare Non-Aeration services sold.
- Tree Shrub Sales # – Enter the total number of Tree/Shrub Annual services sold.
- Tree Shrub Sales Annual $ – Enter the annual contract value of all Tree/Shrub services sold.
- Value Started $ – Enter the combined Lawn Aeration, Lawn Non-Aeration and Tree/Shrub contract/annual value of all the INITIAL services completed.
- Annual Backlog – This is a protected formula field, and it calculates automatically.
- Daily Production – Enter the dollar amount of all Lawncare and Tree/Shrub services from all the technicians’ production totals from their daily route sheets. The figure will also include the INITIAL service charge for new LAWNCARE and TREE/SHRUB services.
Irrigation/Rennovation #
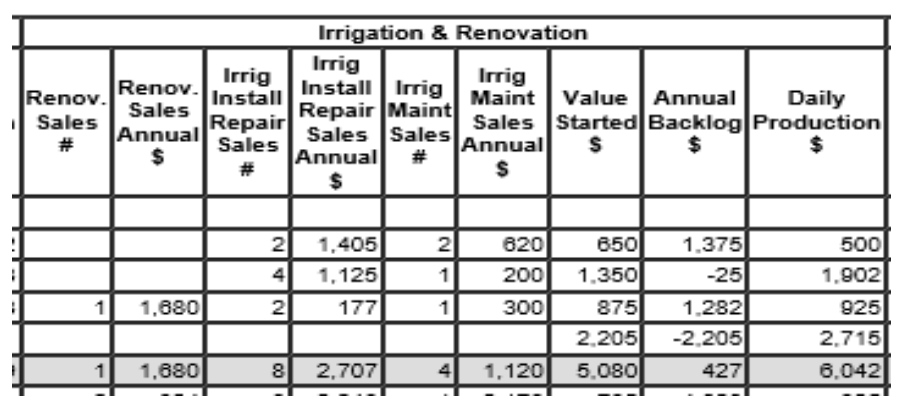
- Reno Sales # – Enter the total number of Renovation Sales sold that day.
- Reno Sales Annual $ – Enter the annual contract value of all Renovation services sold.
- Irrigation Install Repair Sales # – Enter the total number of IrrigInstall/Repair Sales sold.
- Irrigation Install Repair Sales Annual $ – Enter the annual contract value of all IrrigInstall/Repair services sold.
- Irrig Maint Sales # – Enter the total number of Irrigation Maint. Sales sold.
- Irrig Maint Sales Annual $ – Enter the annual contract value of all Irrigation Maint. Sales services sold.
- Value Started $ – Enter the combined Renovation, Irrigation Install/Repair and Irrigation Maint. contract/annual value of all the INITIAL services completed.
- Annual Backlog – This is a protected formula field, and it calculates automatically.
- Daily Production – Enter the dollar amount of all Renovation, Irrigation Installation/Repair and Irrigation Maintenance services from the technicians’ production totals from their daily route sheets. The figure will also include the INITIAL service charge for new RENOVATION, IRRIGATION INSTALLATION/REPAIR AND IRRIGATION MAINTENANCE services.
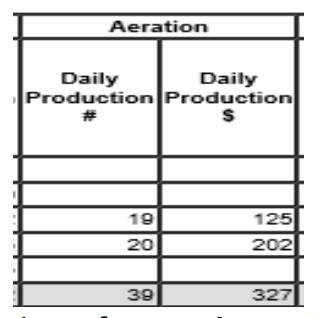
Annual Aerations #
- Daily Production # – Enter the total number of Annual Aerations done on the day you are working on.
- Daily Production $ – Enter the total BILLING value of the Annual Aerations done on the day you are working on.
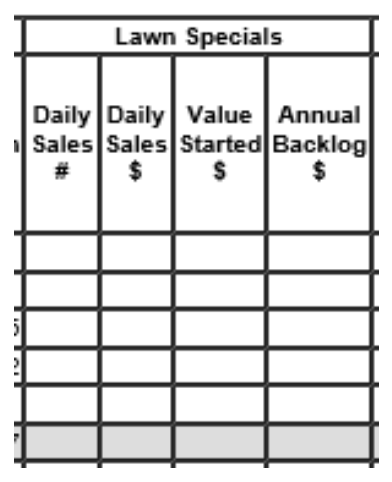
Lawn Specials #
- Daily Sales # – Enter the total number of One Time Specials sold on the day you are working.
- Daily Sales $ – Enter the annual contract value of all One Time Specials sold.
- Value Started – Enter the contract value of the One Time Specials started. (This figure will populate into the “Daily Production” number in the daily “TOTALS” column.
- Annual Backlog – This is a protected formula field, and it calculates automatically.
DOR Totals #
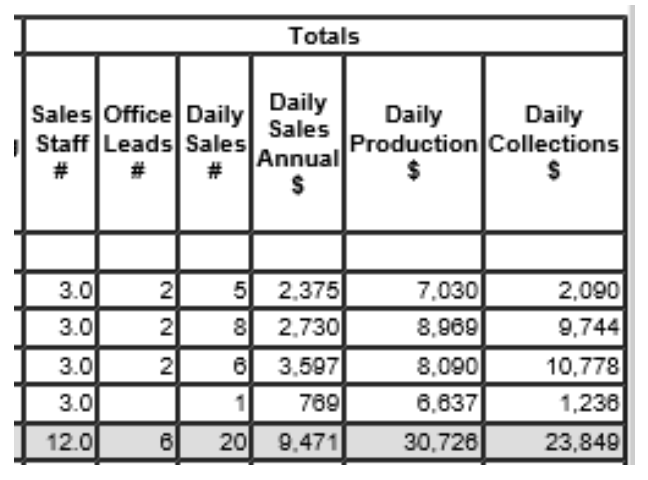
- Sales Staff # – Enter the number of Sales Staff assigned to sell lawn in your service center.
- Office Leads # – Enter the total number of Lawn Office and Leads received for the day. (This figure will be obtained from the Call Log Reconciliation Report found in the reports tab of the Lead Log.
- Daily Sales # – This is a protected formula field, and it calculates automatically. (This is the total sum of all services sold.)
- Daily Sales $ – This is a protected formula field, and it calculates automatically. (This is the total dollar value of all services sold.)
- Daily Production – This is a protected formula field, and it calculates automatically. (This is the total value of all services rendered on the service day you are working on.)
- Daily Collections – Enter the dollar amount of the service center and corporate accounts receivable department LAWN deposit, plus/minus any funds transferred to/from other service centers. (This figure is recorded and obtained from the Daily Deposit log, which has been balanced with the Payments in Total by Service report from Service Pro.)
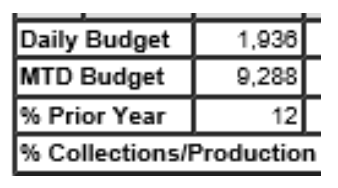
DOR Footers #
These totals come from the figures entered on the DOR. It is a quick glimpse of where the service center is month-to-date.
- Daily Budget – This breaks down the average sales per day and the average completions per day.
- MTD Budget – This breaks down the sales for the month and completions for the month.
- % of Prior Year – The Sales or Production/Revenue in comparison to same time last year.
- % Collections/Production – Month-to-date collections divided by month-to-date production.
Commercial DOR #
DOR Headers #
Headers: These figures are brought forward by the Reporting Department at Corporate as specified below:
- Sales:
- Sales Prior Year – Figures are obtained from prior year DOR for the same month.
- Budget – Figures are obtained from the current month budget sheets, which were prepared and agreed to by General Manager and Regional Managers during their budget session.
- Revenue = Completions = Installs:
- Prior Year – Figures are obtained from prior year DOR for the same month.
- Budget – Figures are obtained from the current month budget sheets, which were prepared and agreed to by General Manager and Regional Managers during their budget session.
- Production Scheduled:
- Total Pest Production Scheduled – Figures are obtained from the Production To Do.
- Monitoring Scheduled – Figures are obtained from the Production To Do.
- Beginning Backlogs Figures:
- Reporting will fill in the Backlog numbers for the sales that were not started the previous month.
- Service Center Daily Progression:
- This section displays the service center name, month and year, as well as the current day of the DOR.
- Working Day # – How many days have elapsed in the month.
- Out of Monthly – How many working days were available at the start of the month.
- % Elapsed – Working days divided by how many days were available reflects the percentage of month gone.
Pest Section #
Total Sales Staff – Enter the number of sales inspectors working that day. (Divide the total sales staff number between Pest, Lawn and Termite.)
Office Lead – Enter the total number of Pest Office and Web Leads received for the day. (This figure will be obtained from the Call Log Reconciliation Report found in the reports tab of the Lead Log.
Jobs Sold # – Enter the total number of PPP/CPP and one-time Special Services sold.
Daily Sales $ – Enter the annual value of all PPP/CPP and the total value of all one-time Special Services sold.
Annual Contract Started – Enter the combined PPP/CPP and Special Services annual value of all the INITIAL services completed.
Pest Backlog – This is a protected formula field, and it is calculated automatically. (This figure is calculated as follows: Daily Sales (Column 4) less the contract Value Started (Column 5) giving the daily backlog (Column 6)). MTD backlog is calculated by taking the beginning backlog (carried forward from previous month, Daily Sales $, minus Contract Value Started.) (This number is balanced against the actual service center Backlog found in the G: directory in the Service Center Excel folder.)
Daily Production $ – Enter the dollar amount of all PPP/CPP services from all technicians’ production totals, from their daily route sheets. The figures will include the initial service charge for new starts and the total charge for one-time special services. (These figures are balanced against the Completed Billing/Production Report found in Service Pro.)
Daily Collections $ – Enter the dollar amount of the service center and corporate PEST deposit, plus/minus any funds transferred to/from other service centers. (This figure is recorded and obtained from the Daily Deposit log, which has been balanced with the Payments in Total by Service.)
DOR Footers #
These totals come from the figures entered on the DOR. It is a quick glimpse of where the service center is month-to-date.
Daily Budget – This breaks down the average sales per day and the average completions per day.
MTD Budget – This breaks down the sales for the month and completions for the month.
% of Prior Year – The Sales or Production/Revenue in comparison to same time last year.
% Collections/Production – Month-to-date collections divided by month-to-date production.
Pretreat Dor, Pretreat Backlog and Pretreat Balancing #
The Pretreat Daily Operations Report (Pretreat D.O.R.) reflects all Pretreat business generated solely by the New Construction Division. It will show, by category, what type of pretreat has been sold, completed, and collected for the month.
As with the regular DOR, the Pretreat DOR must be completed each morning by no later than 10:00 a.m. EST for a companywide DOR to be generated and distributed to our management team. Based on the pretreats set up and scheduled by New Construction, each morning you will record pretreats as follows:
New Construction will email the service center that there is pretreat set up and scheduled in Service Pro. These are main types of pretreats:
- Boracare
- Bait
- Borcare/Bait
- Block/Boracare
- Liquid / Exterior
Only after the pretreat(s) has been performed will the pretreat be added to the Pretreat DOR and Pretreat Backlog.
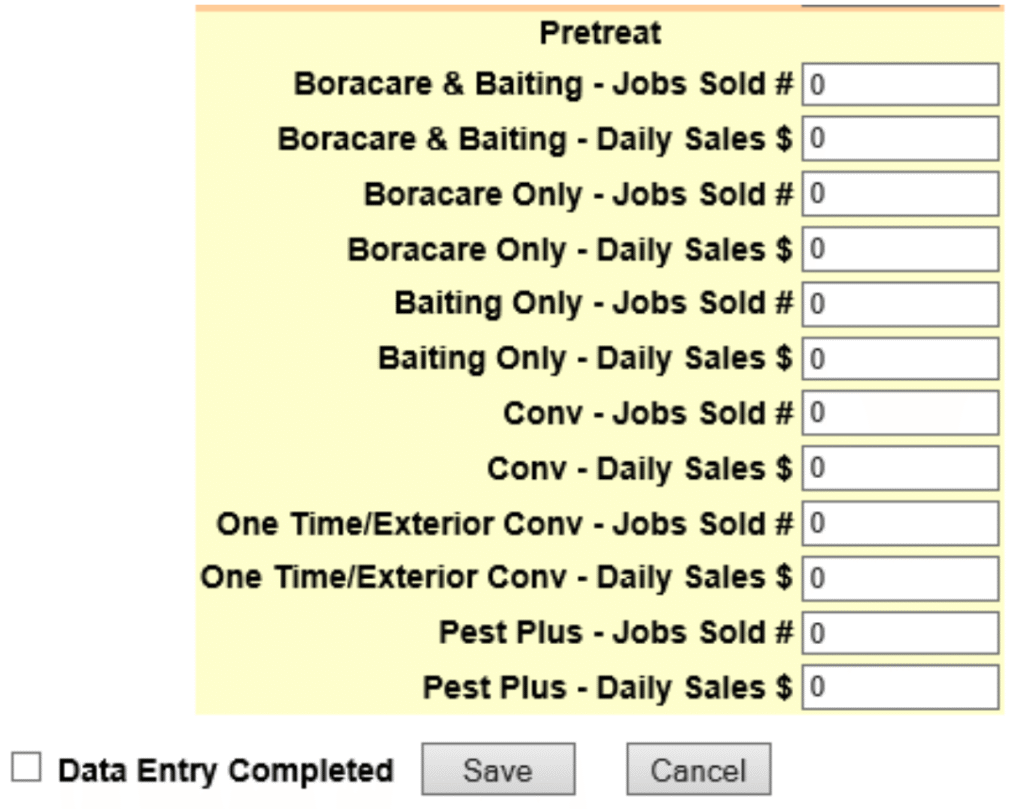
Pretreat Sale Section #
- Boracare & Baiting – Jobs Sold #: Enter the number of Boracare/Bait pretreats where the Boracare portion was completed that day.
- Boracare & Baiting – Daily Sales $: Enter the total dollar value of all Boracare/Bait pretreats where the Boracare portion was completed that day.
- Boracare Only – Jobs Sold #: Enter the number of Boracare only pretreats that were completed that day.
- Boracare Only – Daily Sales $: Enter the total dollar value of all Boracare only pretreats that were completed that day.
- Baiting Only – Jobs Sold #: Enter the number of Bait Install only pretreats that were completed that day.
- Baiting Only – Daily Sales $: Enter the total dollar value of all Bait Install only pretreats that were completed that day.
- Conv – Jobs Sold #: Enter the number of Conventional pretreats that were completed that day.
- Conv – Daily Sales $: Enter the total dollar value of all Conventional pretreats that were completed that day.
- One Time/Exterior Conv – Jobs Sold #: Enter the number of One Time pretreats and chargeable Exterior treatments that were completed that day.
- One Time/Exterior Conv – Daily Sales $: Enter the dollar value of all One Time pretreats and chargeable Exterior treatments that were completed that day.
- Pest Plus – Jobs Sold #: Enter the number of Pest Plus services that were completed.
- Pest Plus – Daily Sales $: Enter the total dollar value of all Pest Plus.
Once the new pretreats have been entered on the DOR, they must be added to the Pretreat Backlog and then balance the DOR and Backlog to each other.
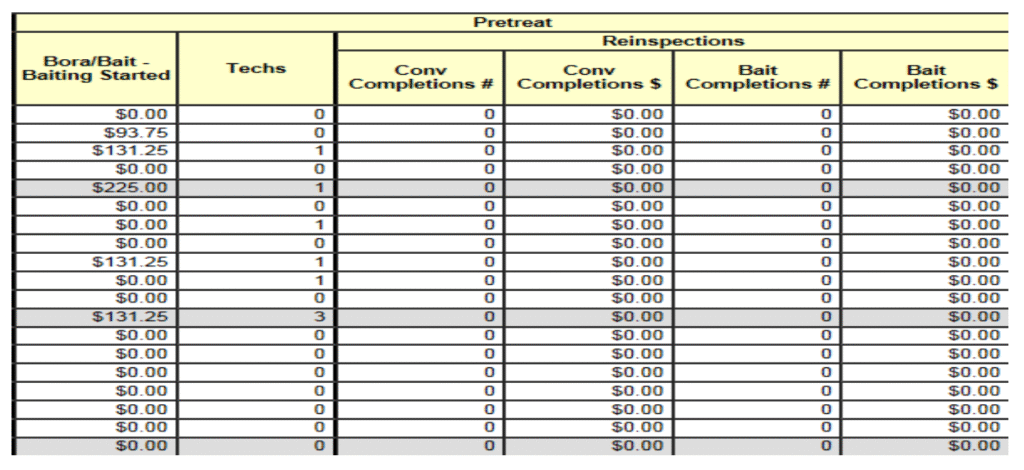
Pretreat Completions (Production) #
- Bora/Bait – Baiting Started $: Enter the total dollar value of all Baiting installs of a Boracare/Bait pretreat that was completed that day. (The DOR automatically counts all other pretreats as completions once the sale is entered on the Pretreat DOR.)
- Techs # – Add all hourly-paid Pretreat Technicians’ hours for Pretreat work completed. Divide the total hours by eight (8) to determine the number of technicians for that day.
- Reinspections – Conv Completions #: Enter the number of Conventional Annual Inspections completed that day. This is used by the New Construction Service Center only.
- Reinspections – Conv Completions $: Enter the production dollar value for all Conventional Annual Inspections completed that day. This is used by the New Construction Service Center only.
- Reinspections – Bait Completions #: Enter the number of Baiting Annual Inspections completed that day. This is used by the New Construction Service Center only.
- Reinspections – Bait Completions $: Enter the production dollar value for all Baiting Annual Inspections completed that day. This is used by the New Construction Service Center only.
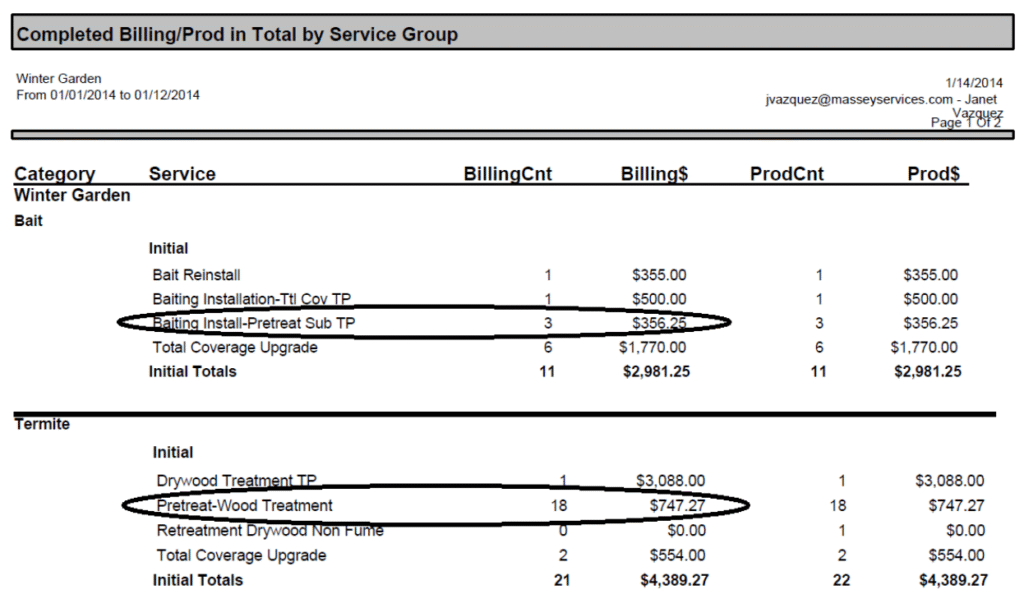
To make certain the DOR and Backlogs are in balance, you will need to run the Completed Billing/Prod in Total by Service Group.
Pretreat Collections #
See main DOR section for deposit procedure.